In recent years, macroeconomic tides have diminished and flowed, but one thing has remained unchanged: Americans’ dim views of the economy.Persistent pessimism has survived talk of a “vibecession,” and election-year anxiety. Now a fresh wave of uncertainty is driven by President Trump’s aggressive economic agenda. Tariffs, proposed changes to the Federal Reserve and conflicting economic indicators have left households, investors and policymakers struggling to interpret where the economy is heading.
Tariffs and tax cuts
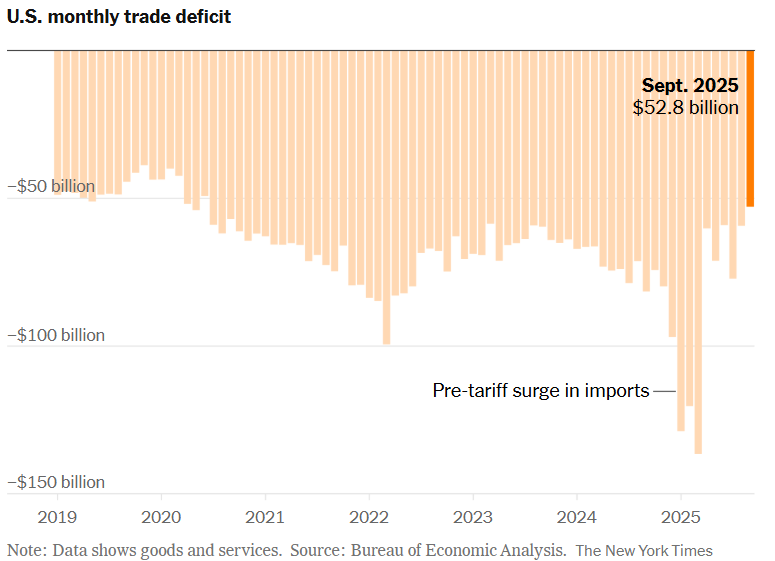
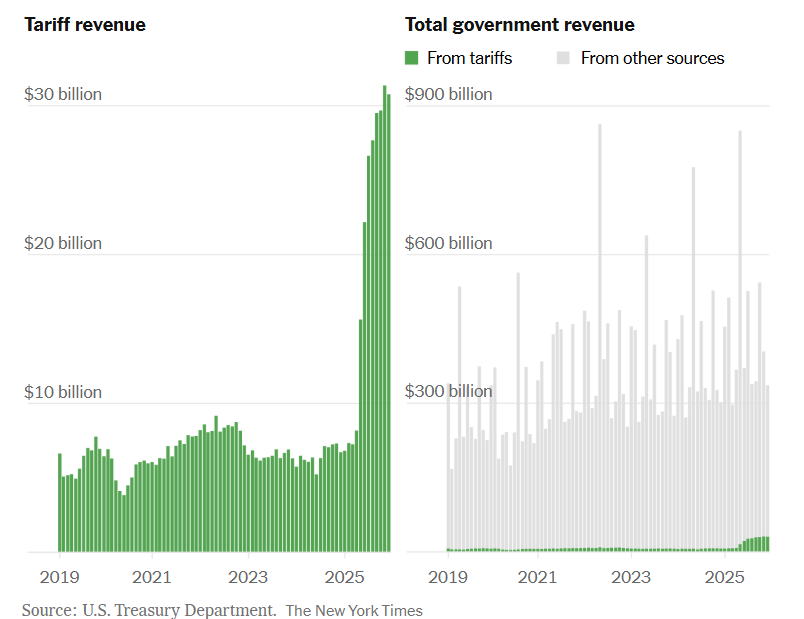
President Trump’s renewed trade war has become one of the central sources of uncertainty. Tariffs have expanded across nearly every major trading partner, helping narrow the trade deficit as exports outpaced imports and pushing tariff revenues to record highs. Still, those revenues remain a small fraction of overall government income and do little to address the federal budget deficit. While the administration frames tariffs as a tool to revive manufacturing and jobs, markets remain focused on their broader economic costs.
A blurry picture in the economic data
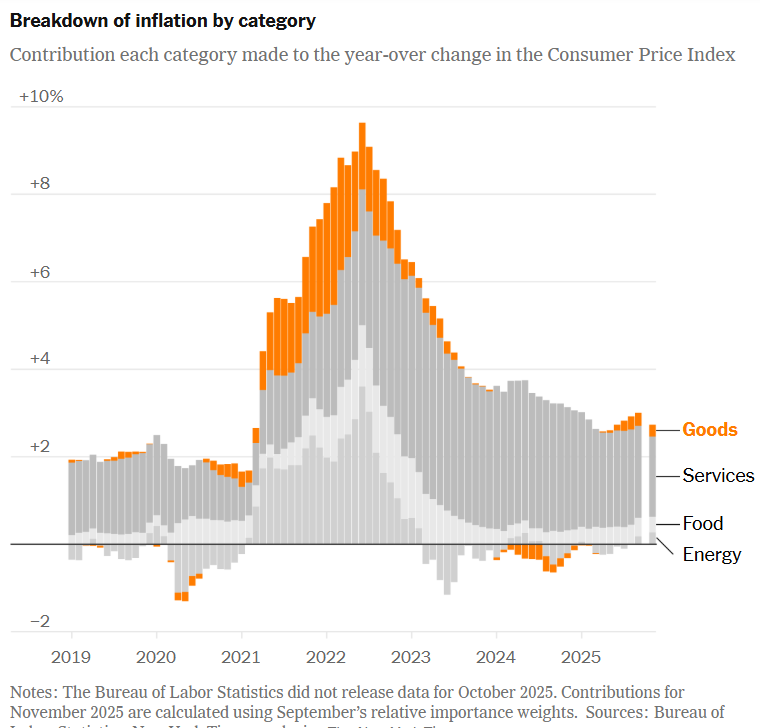
Tariffs are increasingly visible in price data. Goods prices, especially those most exposed to import duties, have risen sharply, contributing to inflationary pressure. Although inflation slowed to 2.7 percent in November, economists caution that the figure is clouded by disruptions from the federal government shutdown. Which is leaving uncertainty over whether tariff-driven price increases will prove temporary or persistent.
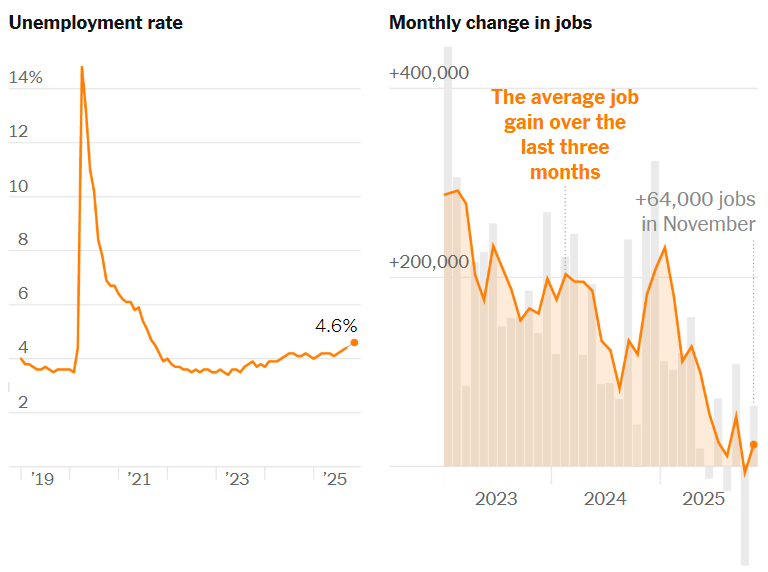
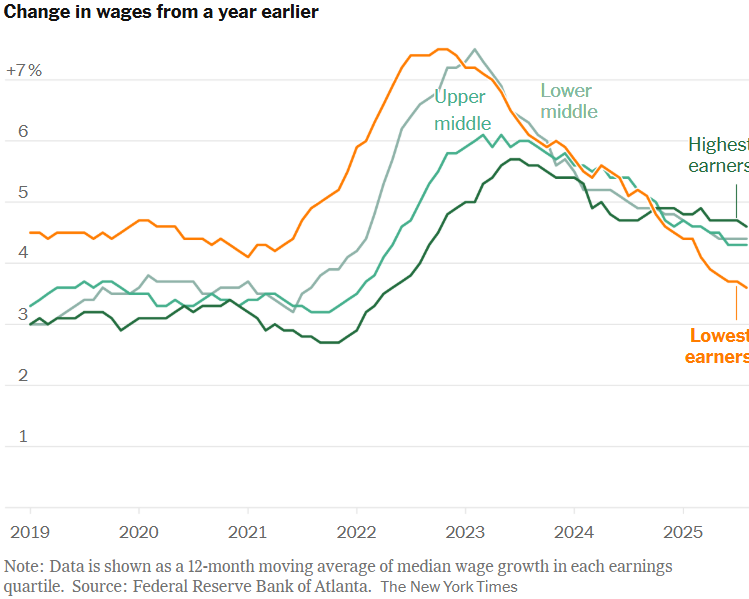
Labor market data is similarly dim. Unemployment climbed to 4.6 percent, the highest in four years, while wage growth slowed to its weakest pace since 2021. Job gains in November offered some relief but failed to fully offset earlier losses, especially after large cuts to the federal workforce. Lower-wage workers have borne the brunt of the slowdown as demand cools in sectors that once drove post-pandemic recovery.
Pressure on Trump and the Fed
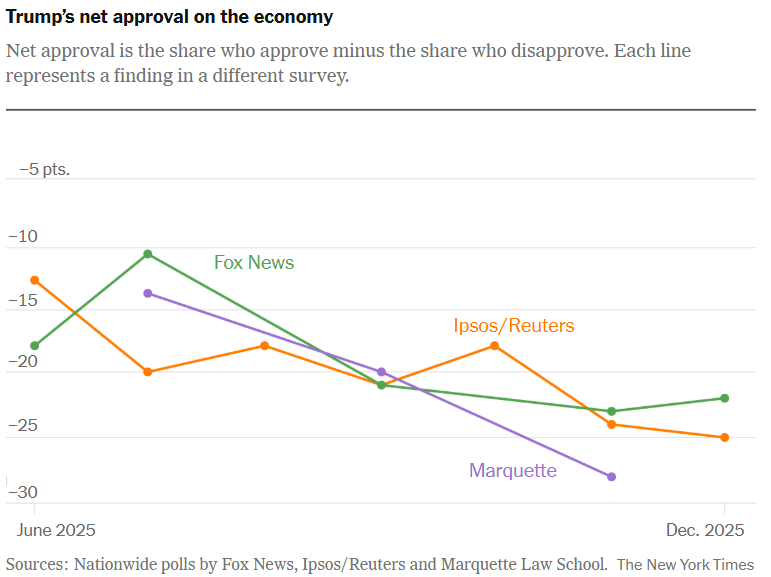
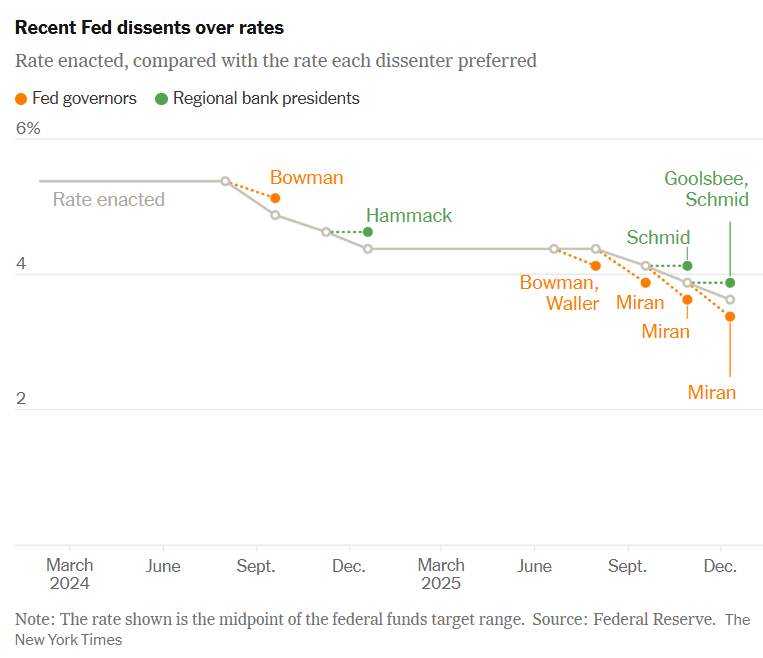
The mixed data has placed pressure on both the White House and the Federal Reserve. The Fed’s latest rate cut exposed deep divisions among policymakers. Underscoring the difficulty of balancing inflation risks against rising unemployment. Jerome Powell acknowledged the central dilemma. “You’ve got one tool… You can’t do two things at once.” Trump, meanwhile, has openly pushed for lower rates and will soon shape the Fed’s leadership, adding another layer of political uncertainty.
A.I. boom, or A.I. bubble?
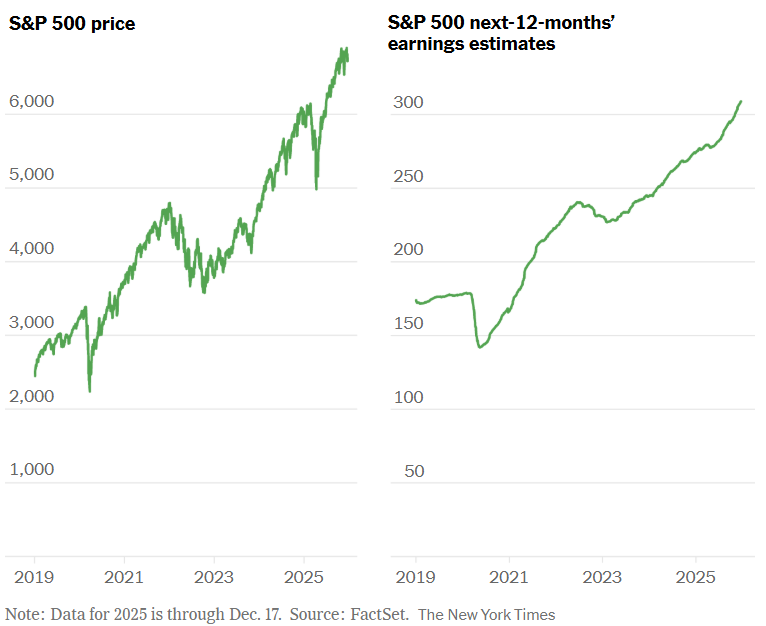
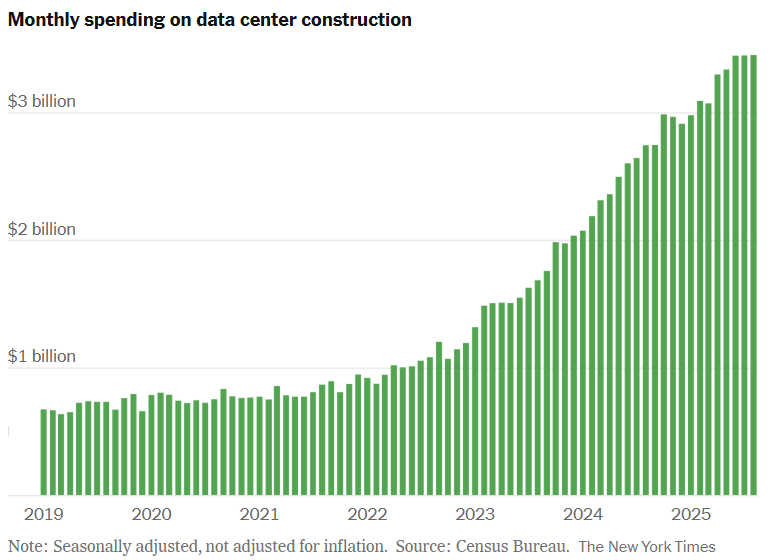
Despite economic headwinds, equity markets have surged. The S&P 500 has repeatedly hit record highs, driven largely by strong earnings expectations and the dominance of big tech firms at the center of the A.I. boom. Investment in software and computing equipment has accounted for the bulk of recent G.D.P. growth, raising concerns about overconcentration. Unlike the dot-com era, however, today’s market leaders are generating substantial profits, tempering fears of an imminent bubble.
Another crypto winter?
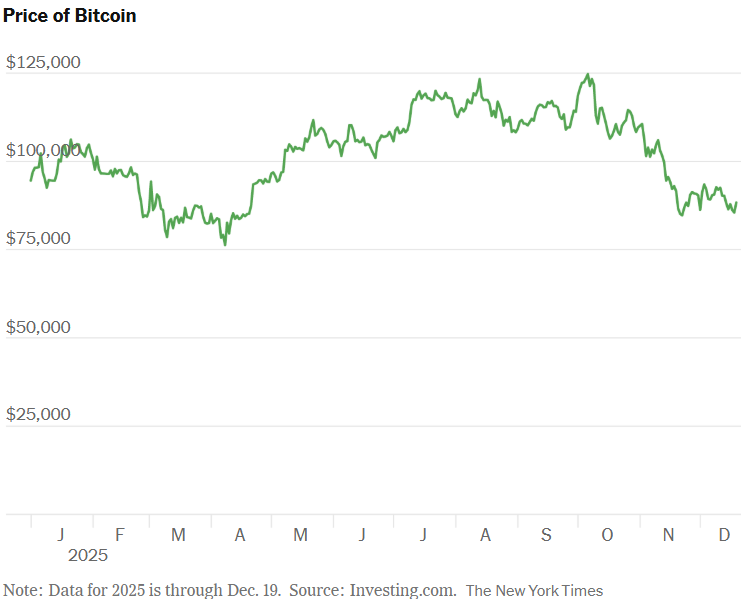
The crypto rally sparked by Trump’s re-election has stalled. Digital asset prices fell sharply after new tariff threats against China, highlighting crypto’s continued volatility despite growing regulatory acceptance. While new federal rules for stablecoins have brought legitimacy, skeptics worry that another crypto downturn could spill into broader financial markets.
Cinematic comfort
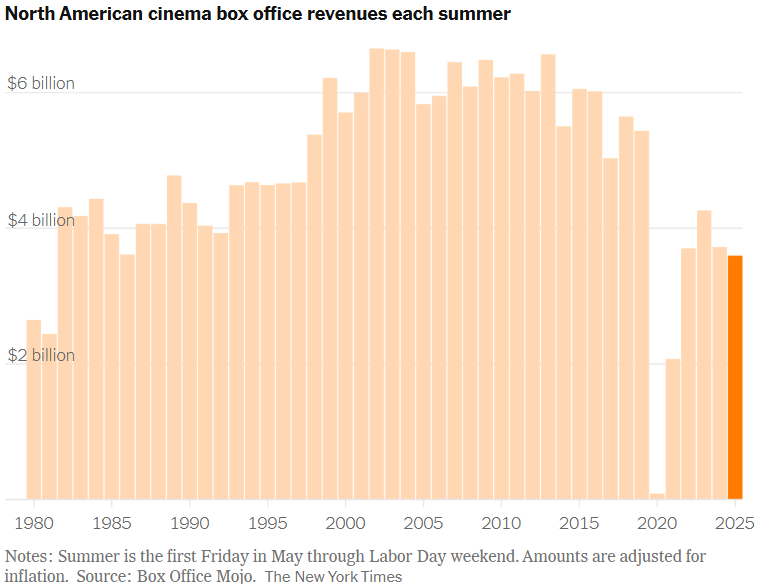
Outside traditional economic indicators, cultural signals also reflect unease. Moviegoing slumped to its weakest summer since 1981, adjusted for inflation, as audiences skipped blockbuster offerings. Even a star-heavy fall season failed to revive ticket sales, fueling concerns about consolidation and long-term damage to the film industry. While holiday releases have offered a glimmer of hope, the broader mood suggests that uncertainty has reached well beyond Wall Street. This is shaping how Americans spend, invest and seek escape.
Reference
Zhang, C. (2025, December 20). From A.I. to Tariffs, 14 Charts That Explain 2025. The New York Times. https://www.nytimes.com/2025/12/20/business/dealbook/charts-2025-economy.html?unlocked_article_code=1.-U8.S2nX.xRz5loOWjnci&smid=nytcore-android-share