
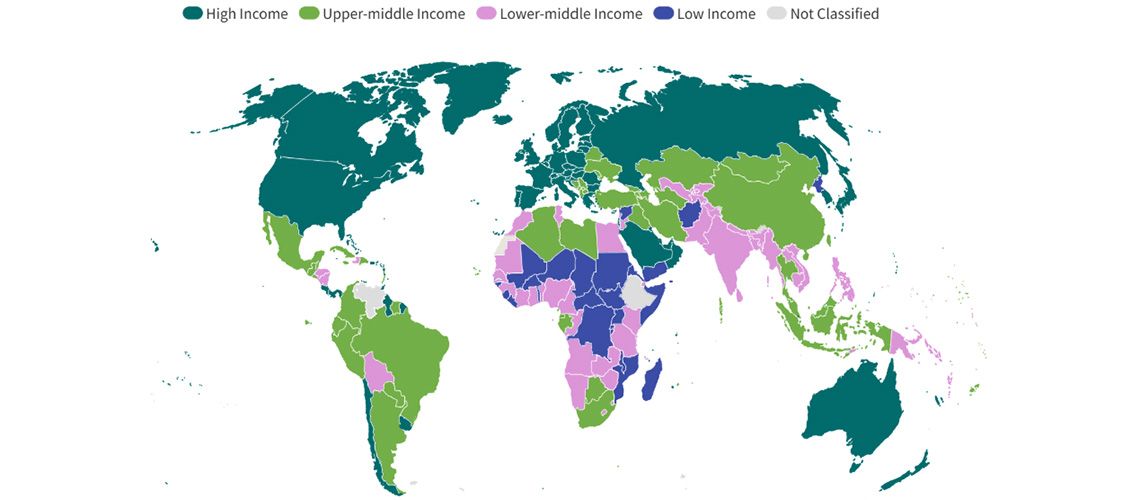
Instead, these upgrades tell remarkably diverse stories. Some nations are riding structural growth waves, while others are recovering from recent crises or simply updating how they measure their wealth. Understanding these unique pathways offers critical insight into the current state of global development.
The Powerhouses: Export Growth and Diversification
A few nations achieved their status through aggressive, sustained economic performance over several years. For instance, Viet Nam has officially entered the upper-middle-income bracket. Powered by an export-led economic model, the nation saw its exports surge by more than 15% across consecutive years, maintaining a robust GDP growth rate of up to 8%.
Similarly, the Philippines demonstrated the power of broad-based expansion. Rather than relying on a single booming sector, the Filipino economy achieved an economy-wide shift. Consequently, it maintained an impressive average GDP growth rate of 5.8% over a five-year period, proving that diversified stability pays off.
The Turnarounds: Resilience and Re-estimations
On the other hand, some nations proved that climbing the World Bank income classifications can be a story of rapid bounce-backs or statistical precision.
Jordan: Interestingly, Jordan’s upward move was the result of a comprehensive national accounts rebasing exercise (updating the benchmark year used to calculate economic data). By using enhanced data sources and broader surveys, statisticians discovered the Jordanian economy was actually 10% larger than previously estimated.
Sri Lanka: Just three years after a severe economic collapse in 2022, the nation staged a resilient recovery. Driven by a major rebound in financial services and tourism, real GDP grew by 5% to narrowly push the country back over the threshold.
Ultimately, these shifts highlight that national wealth is rarely static. Whether driven by industrial booms, post-crisis resilience, or improved data collection, tracking changes in the World Bank income classifications gives businesses and policymakers an invaluable map of where global economic momentum is building next.
Metreau, E., Young, K. E., & Eapen, S. G. (2026, July 1). Who moves up and why? A closer look at the 2026-2027 release of the World Bank Group Country Income Classifications. World Bank Blogs. https://blogs.worldbank.org/en/opendata/who-moves-up-and-why–a-closer-look-at-the-new-world-bank-group-